
Intel:
Sustainable Energy Analysis
(MySql, Tableau, Digital Ocean)
This project focused on evaluating potential locations for a new Intel data center using large-scale U.S.
energy datasets. The analysis centered on understanding regional energy production, demand, and
sustainability in order to identify which areas could provide cost-effective and environmentally
responsible support for a major data facility.
energy datasets. The analysis centered on understanding regional energy production, demand, and
sustainability in order to identify which areas could provide cost-effective and environmentally
responsible support for a major data facility.
Methodology
Using SQL for data querying and Tableau for visualization, I examined three datasets:
. Energy production and demand at the regional level
. Power plant characteristics including energy type, state location, and primary technology
. Plant-level generation totals for renewable and fossil fuel sources
Key tasks included:
1) Identifying regions that consistently produce a surplus of energy
2) Measuring total renewable energy capacity versus reliance on fossil fuels
3) Generating new datasets to compare renewable and fossil energy trends over time
4) Aggregating power plant data to evaluate the density and capacity of renewable infrastructure
5) Visualizing regional and state-level patterns of production and sustainability
Findings
The results highlighted the Northwest region as a consistent leader in renewable energy generation,
with strong contributions from hydropower and wind. A state-level comparison revealed that
Washington State emerged as one of the best candidates, offering both renewable energy reliability
and natural resources critical to chip manufacturing.
with strong contributions from hydropower and wind. A state-level comparison revealed that
Washington State emerged as one of the best candidates, offering both renewable energy reliability
and natural resources critical to chip manufacturing.
Impact
This analysis demonstrates how combining SQL-driven data wrangling with Tableau-based
visualization can generate actionable insights for corporate sustainability decisions. It also reflects a
broader ability to translate complex energy and infrastructure data into meaningful guidance for
high-stakes investment and planning.
visualization can generate actionable insights for corporate sustainability decisions. It also reflects a
broader ability to translate complex energy and infrastructure data into meaningful guidance for
high-stakes investment and planning.
Data Source:
1) Identifying regions that consistently produce a surplus of energy
Explanation:
This query calculates the difference between total energy produced (net_generation) and energy consumed (demand). By summing this difference for each region, it identifies which regions are net energy producers versus consumers. Sorting the results reveals the areas most capable of supporting additional demand, such as a data center
This query calculates the difference between total energy produced (net_generation) and energy consumed (demand). By summing this difference for each region, it identifies which regions are net energy producers versus consumers. Sorting the results reveals the areas most capable of supporting additional demand, such as a data center

2) Measuring total renewable energy capacity versus reliance on fossil fuels
Explanation:
This query compares renewable energy sources (hydropower, wind, solar) to the total net generation in each region. It provides both the raw renewable energy total and the percentage share of renewables. This allows for benchmarking which regions are heavily renewable (e.g., Northwest, California) versus those reliant on fossil fuels
This query compares renewable energy sources (hydropower, wind, solar) to the total net generation in each region. It provides both the raw renewable energy total and the percentage share of renewables. This allows for benchmarking which regions are heavily renewable (e.g., Northwest, California) versus those reliant on fossil fuels
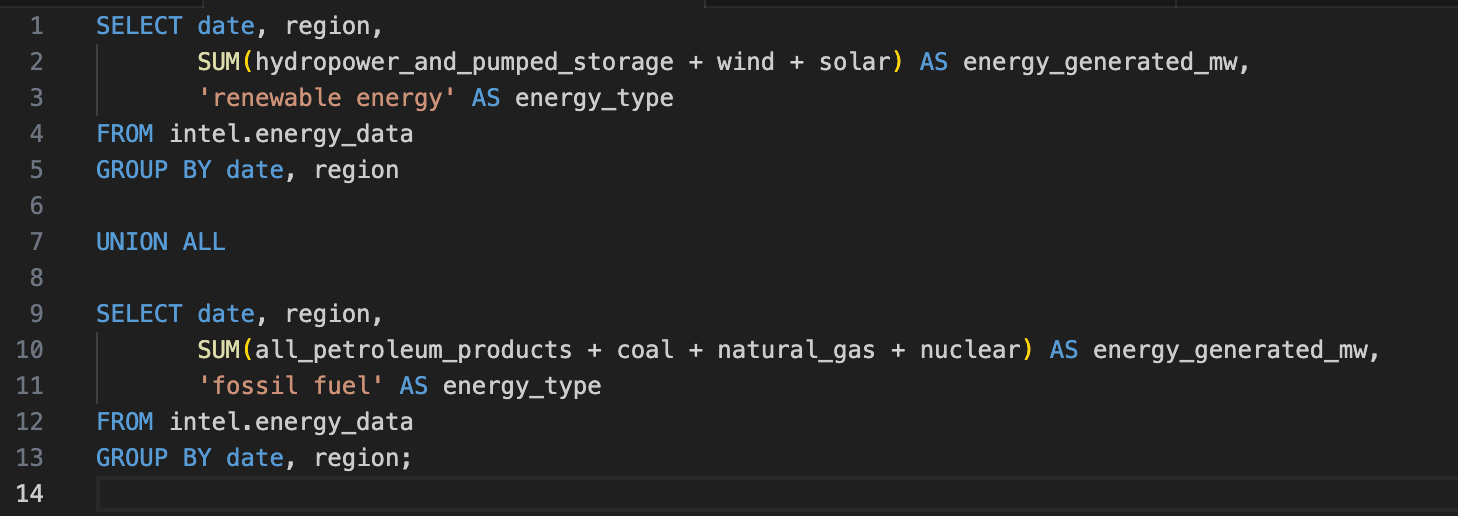
3) Generating new datasets to compare renewable and fossil energy trends over time
Explanation:
This query creates a unified dataset with two categories: renewable energy and fossil fuel energy. By UNION-ing the results, the data can be plotted over time to reveal trends, such as renewable growth or fossil decline. This is critical for long-term sustainability planning
This query creates a unified dataset with two categories: renewable energy and fossil fuel energy. By UNION-ing the results, the data can be plotted over time to reveal trends, such as renewable growth or fossil decline. This is critical for long-term sustainability planning
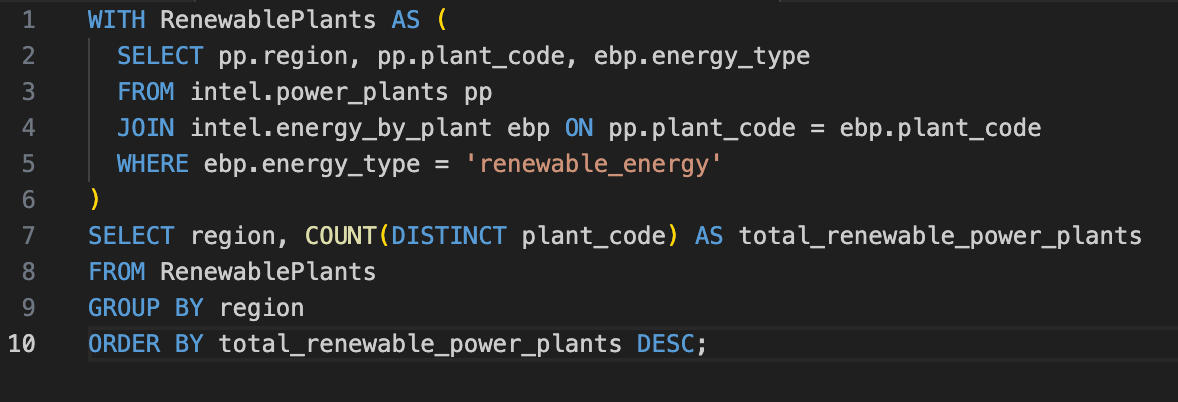
4) Aggregating power plant data to evaluate the density and capacity of renewable infrastructure
Explanation:
This aggregation links power plant data with energy generation data to count renewable facilities in each region. It provides insight into the density of renewable infrastructure, not just production totals. For example, a region with many smaller plants versus fewer, larger plants suggests different types of grid resilience and investment
This aggregation links power plant data with energy generation data to count renewable facilities in each region. It provides insight into the density of renewable infrastructure, not just production totals. For example, a region with many smaller plants versus fewer, larger plants suggests different types of grid resilience and investment
.
5) Visualizing regional and state-level patterns of production and sustainability
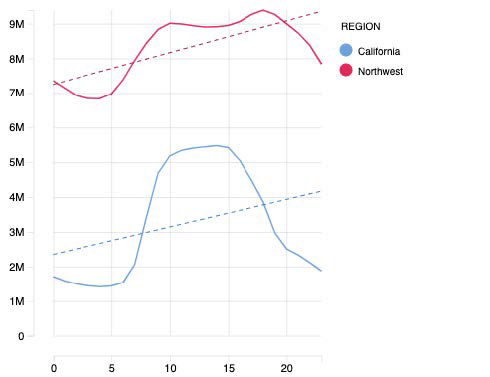
Hourly Renewable Energy (California vs Northwest)
California’s renewable generation peaks midday due to solar, but drops sharply at night. The Northwest, driven by hydropower and wind, maintains steadier output throughout the day, offering more consistent reliability.
.
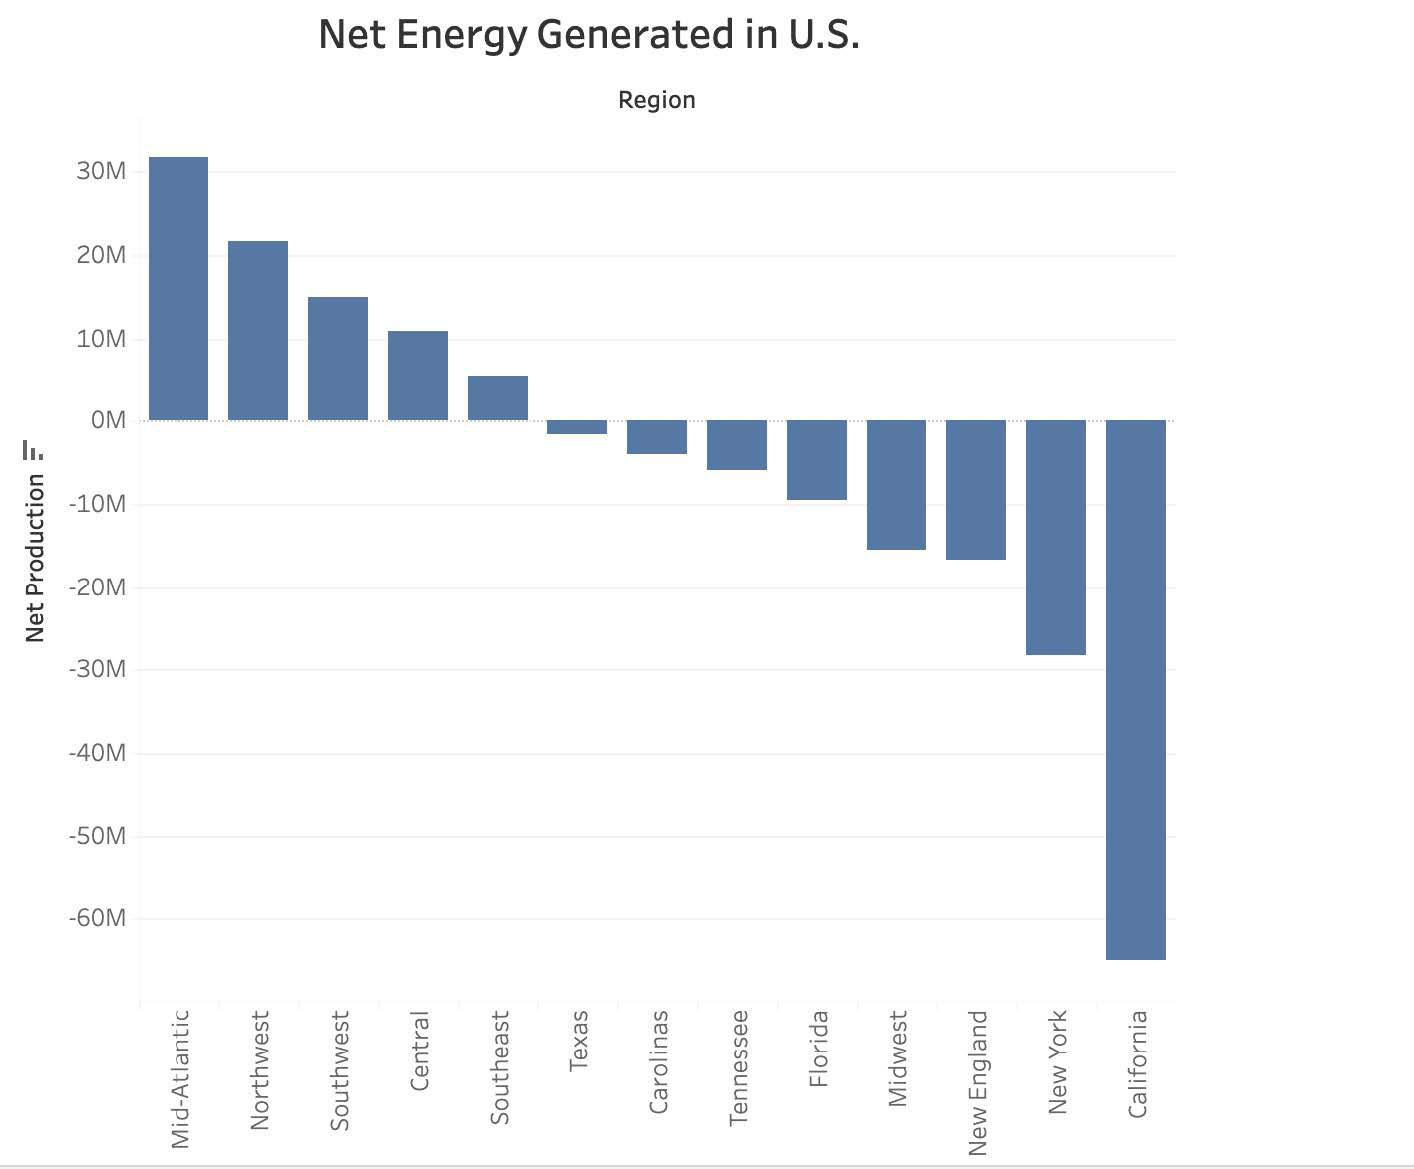
Net Energy Generated by Region
The Mid-Atlantic, Northwest, and Southwest produce large surpluses of energy, while California and New York face major deficits. Regions with consistent surpluses are better positioned to support energy-intensive facilities.
.
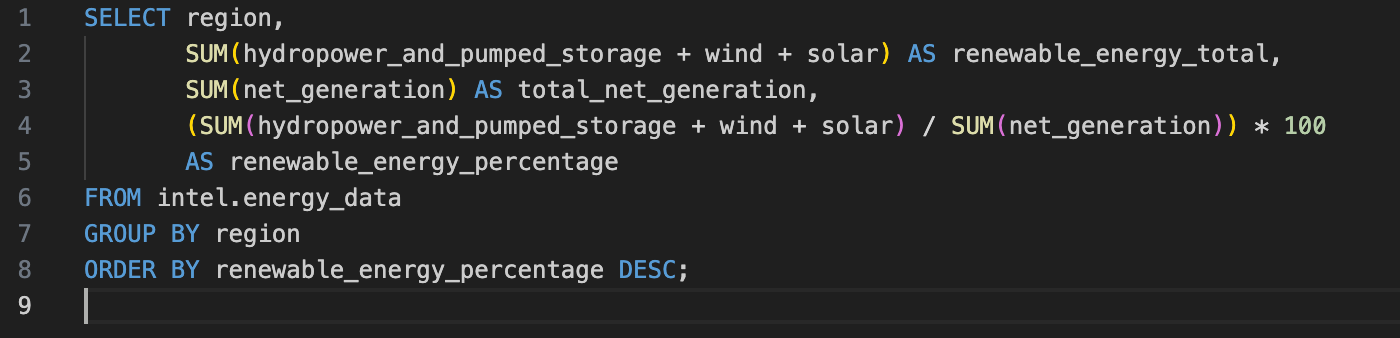
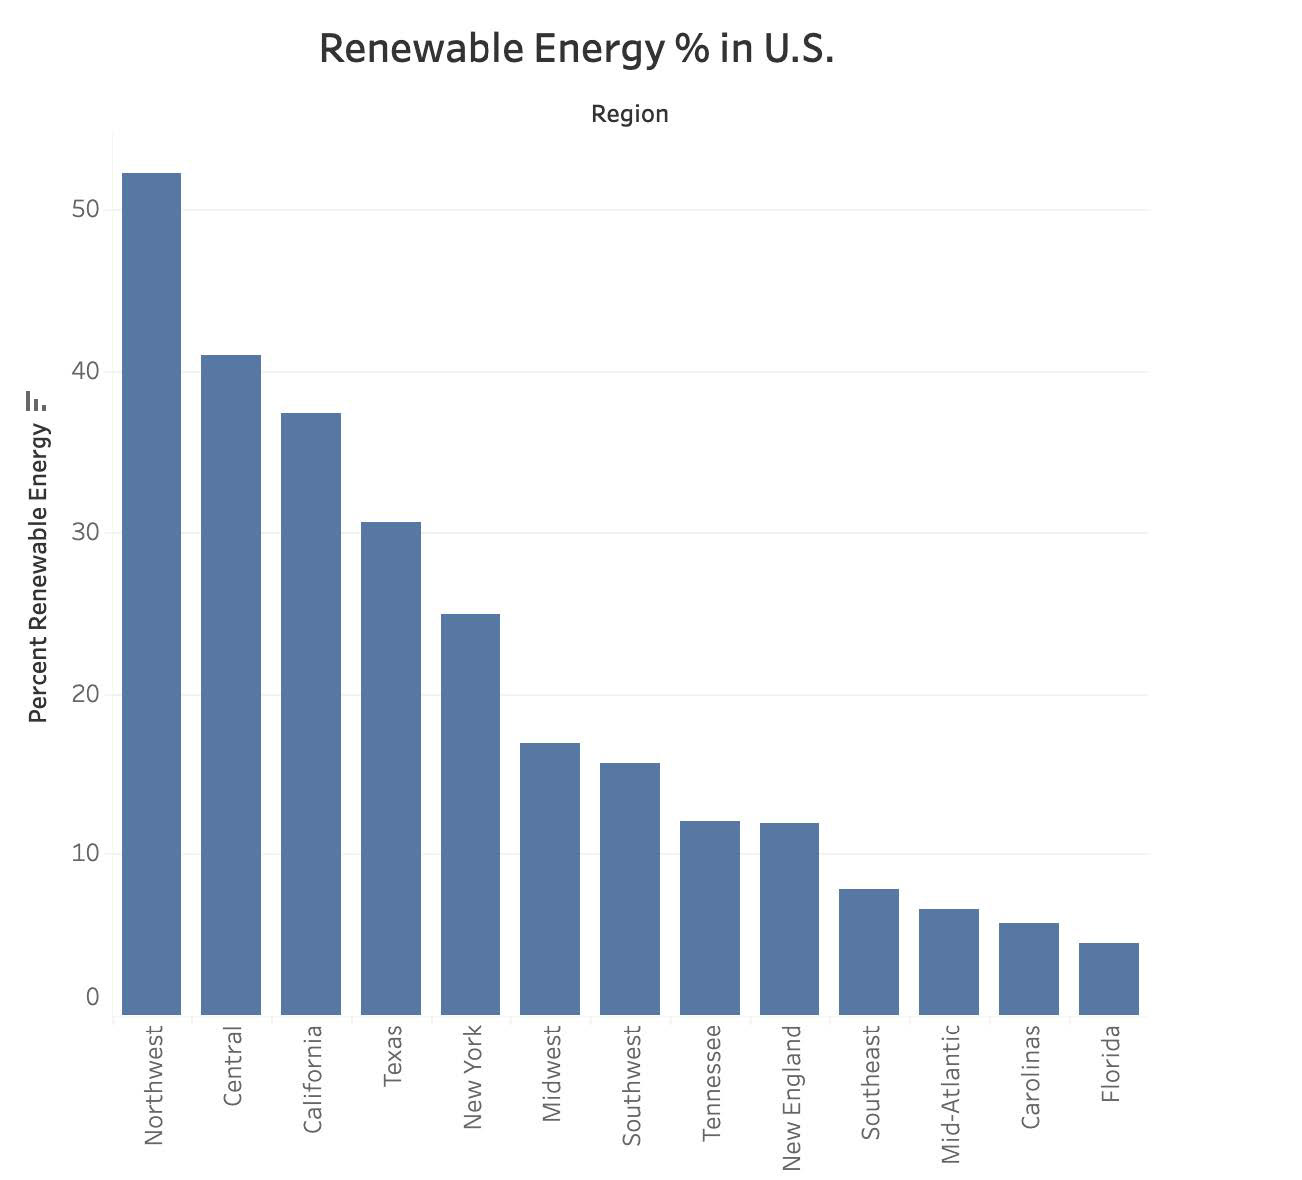
Renewable Energy Share by Region
The Northwest leads with more than 50 percent of energy from renewables, followed by the Central region and California. Southeastern regions lag behind, relying heavily on fossil fuels.
.
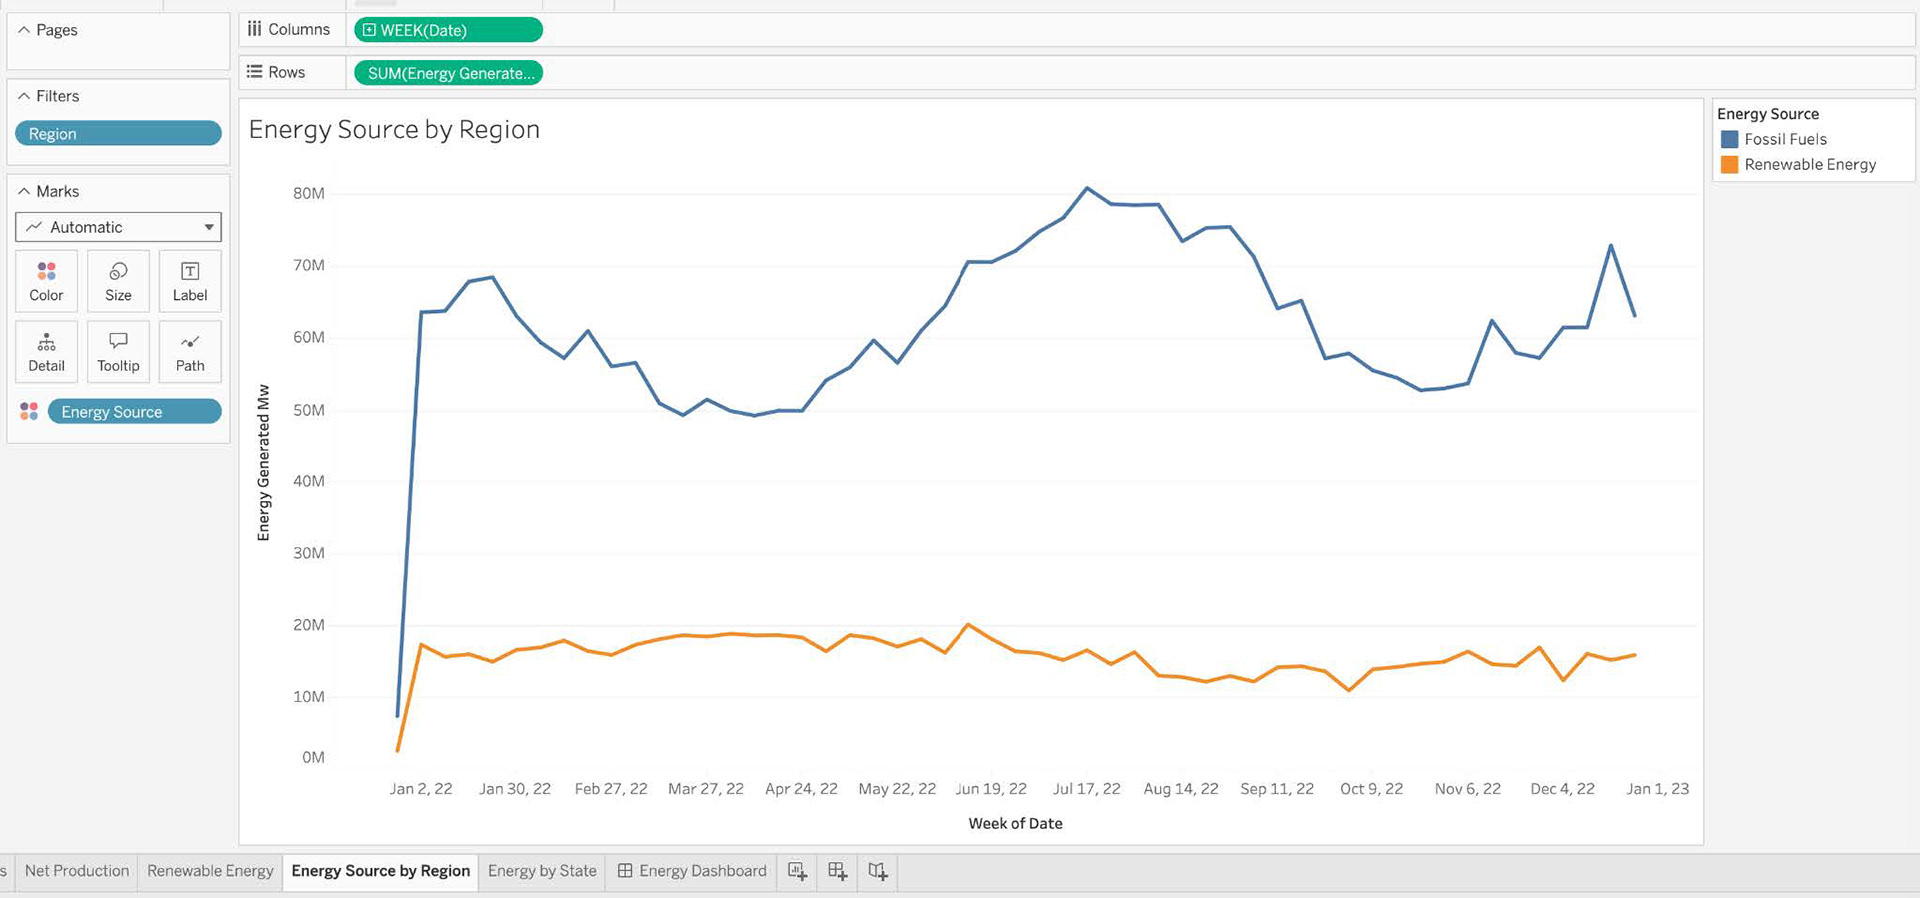
Energy Sources Over Time (Fossil vs Renewable)
Fossil fuels dominate U.S. generation but show seasonal swings tied to demand. Renewables contribute a smaller share but provide a steady baseline, reflecting growing but still limited integration.
.
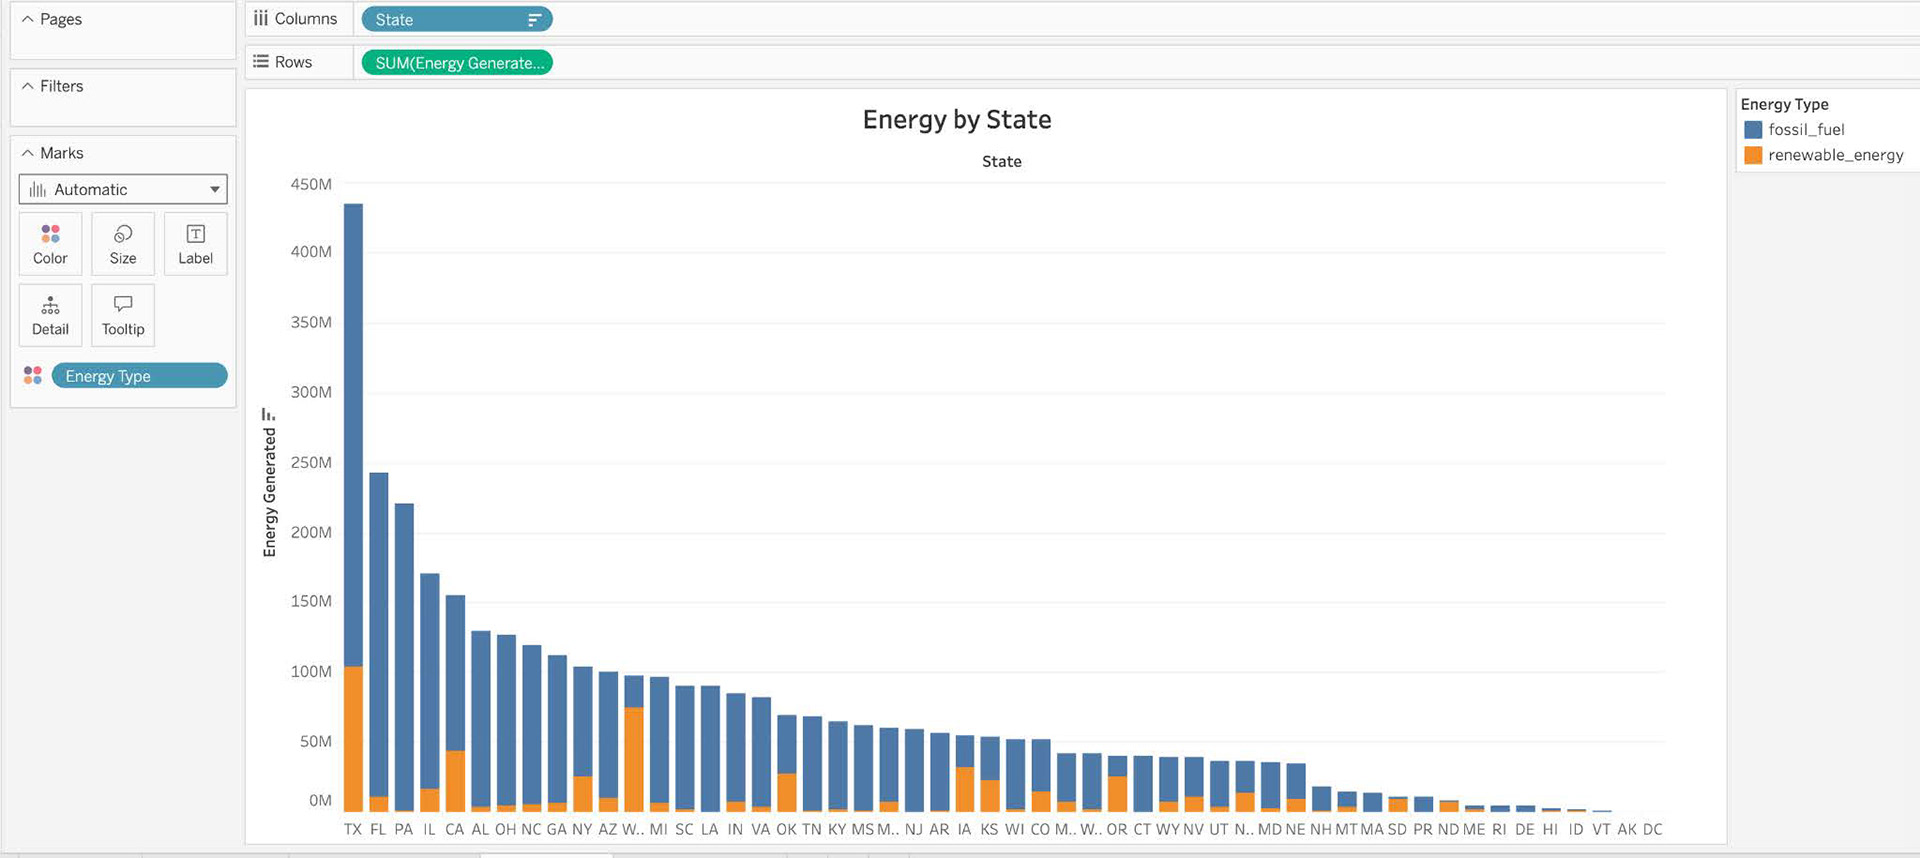
Energy Generation by State
Texas is the top producer, combining strong fossil output with the nation’s largest renewable capacity. California also stands out for balancing high total generation with substantial renewable investment, while Florida and Pennsylvania rely almost entirely on fossil fuels.